SMS Marketing Stats with Open Rates, Engagement, and More (Updated 2025)
Table of contents
Now that there is AI, a lot has been affected. Search engines are not the same and what is even "real" in social media. It’s quite hard for new companies to be visible without spending millions on their marketing efforts.
SMS marketing in this environment stands out as one of the most attractive channels to directly communicate with your customers, especially for eCommerce brands. With integrations, it’s possible to connect CRM to your SMS channels and use it for both transactional and promotional messages.
SMS Marketing Stats 2025
The effectiveness of your SMS marketing depends on how you use it. For reach, it is not the ideal channel, but what it offers is direct communication. SMS open rates are superior to any other channel it is compared to. Here are the stats that can help you develop your next campaign: SMS marketing open rates and benchmarks.
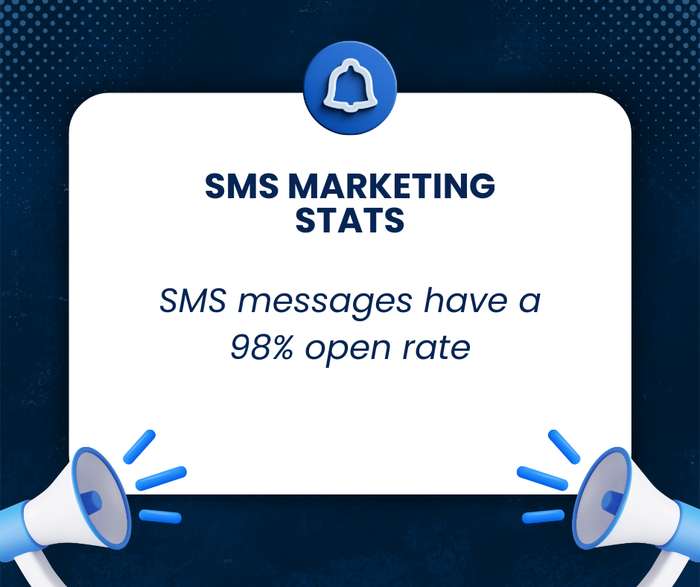
- SMS messages have a 98% open rate, far surpassing email’s average of 20% (Sender, n.d.).
- The average click-through rate for SMS is 18%, significantly higher than email’s 2.5% (Sender, n.d.).
- SMS campaigns achieve a 45% response rate compared to email’s 6% (Business.com, n.d.).
- The average SMS open rate is between 90% and 98% (Forbes, 2025).
- The open rate for text messages is 99%, whereas a good open rate for emails is between 28% and 33% (RedEye, 2024).
- The average text message open rate stands at 99%, with 97% of messages being read within 15 minutes of delivery (RedEye, 2024).
- About 3% of SMS messages are considered spam, compared to nearly 85% of emails (Textedly, 2024).
- Approximately 74 trillion emails are sent every year compared to just 8 trillion text messages (Emma McDermott, 2024).

Engagement and Timing for Text Marketing
In our previous article on email marketing stats, we shared that email marketing offers something that social media, SEM, or SEO cannot even come close to. SMS provides a somewhat similar experience. Although the content is not as rich as in other channels, the engagement is higher than any other channel. Here are the stats to guide you on how to use SMS marketing, including click-through rates and other engagement data.
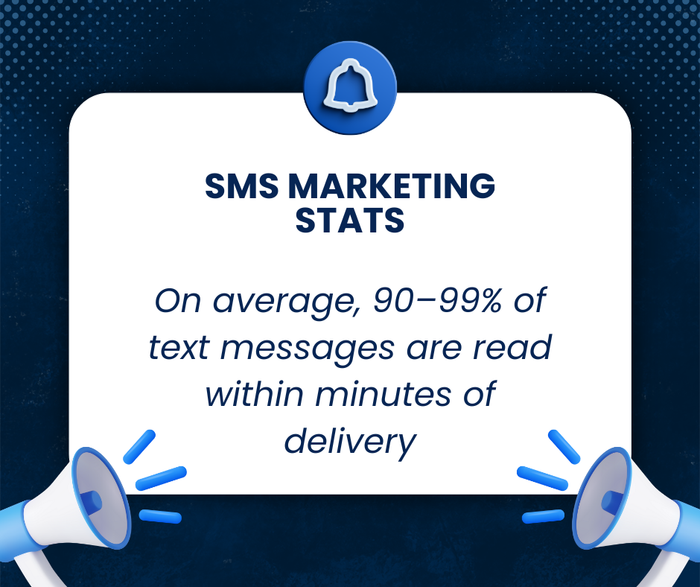
- 90% of SMS messages are read within three minutes of delivery (Validity, n.d.).
- 77% of SMS messages get a response within 10 minutes, more than 3x higher than email (Simple Texting, n.d.).
- 81% of consumers check their text messages within just five minutes of receiving them (Simple Texting, n.d.).
- 59% [of respondents] are more likely to engage with a brand when they’re subscribed to SMS (Klaviyo & Recharge, 2024).
- Brands that integrate SMS into their omnichannel strategies see a 47.7% lift in customer engagement (Omnisend, n.d.).

ROI, Revenue, and Conversion
SMS marketing is relatively more expensive compared to email marketing, but the ROI does not fall short. Effective SMS marketing messages can become the main channel for some businesses. Here are some text marketing stats that can help you make the best decision for your business.
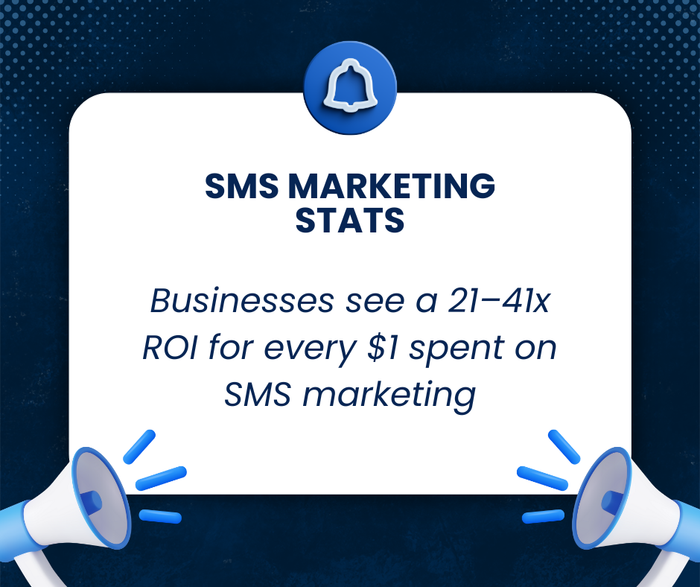
- SMS delivers 21–41 ROI for every $1 spent (Upcity, n.d.).
- Surveyed businesses reported 11–20% of their revenue coming from SMS marketing (Simple Texting, n.d.).
- 68% of consumers spend over $50 on items via SMS (Attentive, n.d.).
- On average, ecommerce marketers generate approximately $71 for every dollar spent on SMS marketing (Oberlo, 2024).
- 53% of surveyed marketers say SMS is one of their top three revenue-driving channels (Attentive, 2024).
- SMS can reduce missed appointments by 80% (Voicesage, 2024).
- 72% of people have made a purchase after receiving a text from a brand (Klaviyo & Recharge, 2024).
- 86% of respondents made 2+ purchases in the last year from SMS messages, up from 55% in 2022 (Klaviyo & Recharge, 2024).
- 65% of people who made an SMS purchase in the last year ended up buying the item earlier than planned because of a promotional text message (Klaviyo & Recharge, 2024).
- 14% of respondents made a purchase when they weren’t thinking about buying at all (impulse buy) (Klaviyo & Recharge, 2024).
- 76% of Cyber Week e-commerce traffic came from mobile devices (Klaviyo & Recharge, 2024).
- 72% of people are willing to receive a text at least once a week (Klaviyo & Recharge, 2024).

Consumer Preference and Opt-In Behavior
SMS marketing trends do not change as much as in other digital channels. The key is to be direct, concise, and highlight the benefit immediately. If you are doubtful about using SMS, here is some customer data to convince you.
- 51% of consumers find SMS marketing useful (Emarsys, n.d.).
- 91% of consumers say they’d opt-in to SMS communications from brands if it improved their experience (Simple Texting, n.d.).
- 75% of consumers prefer to receive promotional content via SMS over other marketing methods (Martech.org, n.d.).
- 12% of customers show their loyalty to a brand by opting into their SMS program (Emarsys, n.d.).
- 93% of U.S. consumers have signed up to receive texts from a business as of 2023 (Attentive, 2024).
- 41% of consumers would rather receive brand updates via texts than emails (Thrive, 2024).
- 75% of clients want to receive offers through SMS (Techjury, 2024).
- Over 90% of consumers text every day, and most check their text messages more than 10 times per day (Simple Texting, n.d.).
- 5 billion people globally send and receive SMS messages, about 65% of the world’s population (Vodafone, 2024).
- Smartphone users send and receive five times more texts than calls (ChicagoTribune, 2024).
- 61% of consumers began texting significantly more during the COVID-19 pandemic (Hubspot, 2024).
- Americans spend an average of 3.5 hours on their phones daily (Exploding Topics, 2024).
- 66% of Americans check their phones 160 times every day (SmallBizTrends, 2024).
- An average person in the U.S. completes six phone calls per day and sends or receives 32 texts (Informate via PR Newswire, 2024).

Demographic and Regional Preferences
Text marketing is not global due to its nature. You need to develop your campaign separately for each country. More importantly, you need to understand if it is the right channel for your target group. Here are some SMS marketing stats to help you choose your target audience wisely, so you do not waste your money.
- 47% of U.S. Millennials favor brand communications via text messages (Statista, n.d.).
- 75% of Millennials (ages 27–42) prefer texting to talking on the phone (Research Brief, 2024).
- 71% of 30- to 44-year-olds said they would text a business more frequently if they had the opportunity (ZDnet, 2024).
- 65% of 18- to 29-year-olds felt the same about texting a business more frequently (ZDnet, 2024).
Business Adoption and Usage
There are not many ways to use SMS to engage customers. It is not as attention-grabbing as email marketing and is not always the most cost-efficient channel for transactional messages. Here are some SMS marketing statistics to show how different businesses use text marketing.
- 53% of marketers stated SMS open rates as the primary reason for using SMS as a channel (Statista, n.d.).
- Businesses that text customers are 683% more likely to report digital marketing success than those that don’t use text messaging (Simple Texting, n.d.).
- 80% of businesses are using software to automate their SMS strategy (Simple Texting, n.d.).
- 86% of businesses find that texting generates more engagement than email (Textmunication, 2024).
- 79% of marketers using SMS use it as a retention channel (Attentive, 2024).
- Strong customer engagement is the number one reason marketers use SMS (Forrester, 2024).
- Customers opened 28% more support tickets through SMS in 2021 compared to 2020 (Zendesk, 2024).
- 67% of insurance agents send and receive MMS messages to mail quotes and claims (Source 3, 2025).
- Average SMS opt-in rates by industry: Healthcare: 49%; Finance: 46%; Technology: 19%; Education: 17%; Insurance: 12%; Nonprofit: 5%; Other industries average: 10% (Contact Consumers, 2024).
Market Size, Growth, and Investment
The text message market is a growing area due to what it offers, unlike other channels. It is not ideal for acquiring new customers, but it can be essential for retention, and businesses are aware of this. Here is some SMS marketing market data.
- The SMS market is expected to hit $12.6bn in 2025 (Grand View Research, n.d.).
- Businesses worldwide spend over $327 billion on texting (Dexatel, 2024).
- Global spending on SMS marketing amounts to $327.1 billion (Statista, 2025).
- 60% of business owners intend to boost their budget allocated for SMS marketing (DDIY, 2024).
Customer Service and Support Preferences
- 90% of people prefer texting with businesses over a phone call (SMS Comparison, 2024).
- SMS response rates are 295% higher than phone call response rates (BSG, 2024).
- 80% of people don’t pick up the phone for numbers they don’t know (Pew Research Center, 2024).
AI and Automation in SMS
- 77% cited a positive experience with text-based intelligent assistants (Statista, 2024).
- 83% of businesses that text their customers have incorporated AI into their SMS marketing strategy (SimpleTexting, 2024).
Risks, Unsubscribe Rates, and Compliance
- 23% of consumers would ditch a brand if they “spam” too much with marketing outreach (Emarsys, n.d.).
- 78% of respondents report feeling annoyed by text messages from brands (Validity, 2024).
- 28% say they stopped buying from a brand as a result of unhelpful texts (Validity, 2024).
- 84% of respondents say they have received SMS messages from a company they don’t remember signing up with (Validity, 2024).
- Americans received 225 billion “robotexts” in 2022 (Robokiller, 2024).
- 61% of people said they unsubscribe from SMS because they receive too many messages (Klaviyo & Recharge, 2024).
Final Words
In conclusion, SMS marketing continues to prove itself as one of the most effective channels for businesses seeking direct and immediate customer engagement. The SMS marketing statistics reviewed here show consistently high open rates, rapid response times, and impressive ROI, making it a vital tool in a digital landscape where visibility is increasingly challenging. From transactional alerts to promotional campaigns, SMS marketing stats highlight that customers not only prefer text communications but also act on them faster than other channels. As businesses increasingly integrate AI, CRM systems, and omnichannel strategies, leveraging SMS marketing data and text message marketing statistics can help maximize engagement, conversions, and overall customer satisfaction. By paying attention to metrics such as SMS open rates, click-through rates, and opt-in behavior, brands can craft strategies that are both efficient and effective in reaching the right audience. For anyone looking to optimize their digital marketing efforts, these text marketing stats and SMS marketing benchmarks offer a clear roadmap for success in 2025 and beyond